Web Development
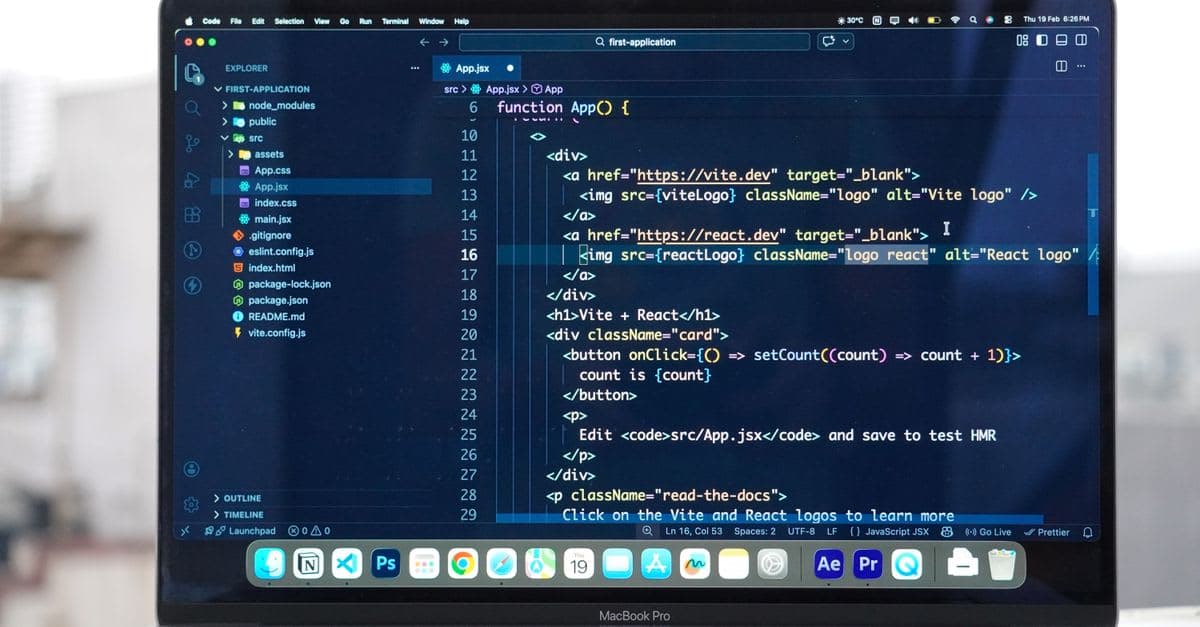
Mastering React Performance Optimization
Mastering React Performance Optimization helps teams reduce load time, re-renders, and UI lag with practical React, Next.js, and profiling strategies.
S
Shayma Parween
Lead Developer
Mar 8, 2024
10 min read
Mastering React Performance Optimization means finding the specific parts of a React application that slow users down and improving them in the right order. In practice, that usually starts with measuring render cost, JavaScript bundle size, and data-loading behavior, then fixing the biggest bottlenecks with targeted changes such as memoization, code splitting, virtualization, and better state management.
Key takeaways
- React performance should be measured first, then improved with targeted fixes rather than broad rewrites.
- The most common causes of slow React apps are unnecessary re-renders, oversized bundles, expensive rendering logic, and inefficient data fetching.
- Memoization, code splitting, virtualization, and careful state design solve many React bottlenecks when applied selectively.
- Performance work is most effective when it is built into the development process, not treated as a one-time optimization task.
For business teams, the goal is not an abstract technical score. It is a faster interface, fewer abandoned sessions, smoother operations for internal users, and a frontend that can scale without constant rework.
Why React performance matters to business outcomes
A slow React app does not just feel inconvenient. It increases friction in sales workflows, delays employee productivity, and can make complex digital products look unreliable even when the backend is healthy. When a dashboard lags, a checkout form stutters, or a client portal takes too long to become interactive, users often blame the product as a whole.
That matters even more for companies operating across the USA, UK, Canada, Australia, UAE, Saudi Arabia, Qatar, and the Netherlands, where users may access the same application from different network conditions and device classes. A frontend that performs acceptably on a developer laptop can feel very different for a field team on mobile data or a finance user working inside a large enterprise browser environment.
React is fast when it is designed and maintained well. The trouble usually appears when teams add features quickly without revisiting rendering patterns, data flow, bundle size, or third-party dependencies. At eSparks, we usually see performance issues emerge not from React itself, but from accumulated decisions that were reasonable in isolation and expensive in combination.
Mastering React Performance Optimization starts with measurement
The first rule of optimization is simple: measure before you change anything. Without a baseline, teams often spend time on cosmetic improvements while the real bottleneck remains untouched. For React applications, that baseline should include both user-facing metrics and component-level diagnostics.
Useful starting points include Core Web Vitals such as LCP, INP, and CLS, along with browser profiling tools. Chrome DevTools, React DevTools Profiler, Lighthouse, and WebPageTest can show whether the problem is initial load, heavy scripting, layout instability, or repeated rendering. In production, tools like Sentry, Datadog, New Relic, and OpenTelemetry-based monitoring can help you see where real users are struggling rather than where local testing feels slow.
A practical measurement sequence looks like this:
- Identify the slow user journey. For example: homepage load, search results, checkout, or admin dashboard navigation.
- Reproduce the issue on a real device profile and network condition.
- Check whether the bottleneck is bundle size, rendering, data fetch latency, or third-party scripts.
- Use the React Profiler to find components that render too often or take too long to commit.
- Compare before-and-after results after each change so you know which fix actually helped.
This approach matters because React performance work is often multidimensional. A page may feel slow because it downloads too much JavaScript, because a table renders 5,000 rows at once, or because a parent component keeps re-rendering every child. The right fix depends on which layer is responsible.
Common React bottlenecks to watch for
One of the most common issues is unnecessary re-renders. In React, a parent update can cascade into child components if props, context values, or functions are recreated on every render. This is especially common in dashboards, forms, and admin panels where state changes frequently. Overusing Context for highly dynamic state can also trigger broad updates that are difficult to reason about.
Another frequent bottleneck is oversized JavaScript bundles. Teams often import entire utility libraries, large charting packages, rich editors, or unused UI modules without realizing the cost. If the first page has to parse and execute too much JavaScript, the user sees a delay before the interface becomes interactive. This is a common reason to use route-based code splitting and lazy loading.
Rendering too much UI at once is another predictable problem. Large tables, infinite feeds, search result lists, and kanban boards can become expensive if the app tries to paint every item simultaneously. In those cases, virtualization with libraries such as react-window or react-virtualized can make a major difference by rendering only what is visible.
Data fetching also plays a role. Repeated requests, poorly cached API responses, and loading patterns that block the interface can make a React app feel sluggish even when components are efficient. Tools such as TanStack Query or SWR help by adding caching, request deduplication, retries, and stale-while-revalidate behavior that keeps the UI responsive.
Practical techniques that usually deliver the biggest gains
The most effective improvements are usually boring, disciplined, and easy to explain to non-engineers. Start by removing obvious waste, then make your rendering and data access patterns more deliberate. In many projects, that sequence delivers more value than deeper architectural changes.
Common high-impact techniques include:
- Code splitting with React.lazy, Suspense, and route-level boundaries so users only download what they need.
- Memoization with React.memo, useMemo, and useCallback when a component is demonstrably re-rendering too often.
- Virtualization for long lists, tables, and timeline views.
- Debouncing or throttling for search inputs, filters, resizing, and other rapid interactions.
- Image optimization and modern formats, especially in content-heavy interfaces.
- Avoiding unnecessary prop drilling by using state locality rather than pushing everything into global state.
- Reducing dependency weight by replacing multi-purpose libraries with smaller, targeted alternatives when possible.
The key is restraint. Memoization is not automatically good; if a component is cheap to render, the added complexity may not help. Likewise, code splitting is useful, but excessive micro-splitting can create too many network requests and complicate caching. We usually recommend applying these techniques only when profiling shows clear evidence.
For example, a SaaS analytics app might benefit more from virtualizing a 10,000-row report than from optimizing its landing page hero animation. A B2B procurement portal may gain more from route-level code splitting and smarter query caching than from deep memoization in static components. The right optimization follows the usage pattern.
A decision framework for choosing the right fix
When teams are deciding where to spend time, we recommend a simple framework: impact, effort, and risk. First, ask which slowdown affects the most users or the most valuable workflow. Second, estimate how hard the change will be to implement and test. Third, consider whether the fix could introduce bugs, increase complexity, or make the codebase harder to maintain.
A typical prioritization order looks like this:
- Fix obvious UX blockers first, such as visible jank, long task blocking, or huge initial bundles.
- Improve expensive render paths, especially tables, dashboards, and form-heavy workflows.
- Optimize data loading and caching so the UI stays responsive under normal use.
- Add code splitting where pages or features are clearly separated.
- Review architecture only if local fixes do not solve the problem or the app has grown beyond its current structure.
This framework helps avoid a common mistake: treating performance like a blanket refactor project. In reality, many React applications need 3 to 8 targeted changes rather than a wholesale rewrite. Depending on scope, a focused optimization sprint may take a few days for a smaller product or a few weeks for a multi-page enterprise application.
If the app is already in production, we also recommend creating a performance budget. That can include limits on initial JavaScript payload, acceptable load times for critical journeys, and thresholds for render frequency on major screens. The purpose is not to chase perfection; it is to prevent slowdowns from creeping back in after every feature release.
Architecture choices that affect long-term performance
Some React performance problems are really architecture problems. A frontend that grows without a clear component strategy often accumulates tightly coupled state, duplicated logic, and features that all depend on one another. Over time, every new enhancement becomes a risk to speed and stability.
Next.js is often a strong choice for public-facing apps because it supports server-side rendering, static generation, route-based splitting, and modern loading patterns. That does not mean every screen should be server-rendered. Internal tools, authenticated portals, and data-heavy applications may benefit more from selective rendering strategies and client-side caching than from aggressive SSR.
State management also matters. Not every application needs Redux, and not every application should use Context everywhere. Teams should choose the smallest tool that fits the data flow. For local UI state, component state is often enough. For shared server state, query libraries usually outperform hand-rolled fetching logic. For truly complex domain state, a structured store such as Redux Toolkit or Zustand can be justified if used carefully.
This is also where technical governance pays off. In our work with product teams, including clients working through eSparks, the best long-term results come from setting patterns early: how to fetch data, where to store state, how to load large modules, and what performance checks happen before release. That consistency matters more than any single optimization trick.
Building performance into delivery, not bolting it on later
Sustainable optimization is a process, not a one-time cleanup. The most reliable teams bake performance into code review, QA, and release workflows so regressions are caught before users do. That includes checking bundle growth, profiling expensive components, and monitoring key journeys in production.
A practical operating model is:
- During planning: ask whether a new feature affects bundle size, render cost, or data-fetch volume.
- During implementation: profile the affected screen rather than assuming the code is efficient.
- During QA: test on slower devices, not just high-end desktops.
- After release: monitor the same journeys in production and compare them to your baseline.
For many organizations, the cost of improvement is moderate compared with the cost of ongoing friction. A focused review and optimization cycle may take a short sprint for a narrow app or several sprints for a large platform, depending on how many screens and dependencies are involved. The benefit is a frontend that remains usable as the product grows, instead of slowing down every time the roadmap expands.
The broader strategic point is that performance is part of product quality. A fast React application communicates control, maturity, and attention to detail. For decision-makers evaluating software partners, that is often a strong indicator that the same team will also handle reliability, scalability, and maintainability with discipline.
Frequently Asked Questions
What is the first step in Mastering React Performance Optimization?
The first step is measurement. Use React DevTools Profiler, Chrome DevTools, and production monitoring to identify whether the problem is rendering, bundle size, data fetching, or layout instability before changing code.
Which React optimization usually has the biggest impact?
The biggest gains often come from reducing unnecessary re-renders, splitting large bundles, and virtualizing long lists or tables. The best fix depends on the bottleneck, so profiling should guide the priority.
Does memoization always make React faster?
No. Memoization helps when a component renders often and the render cost is meaningful, but it can add complexity and sometimes provide little benefit. It should be applied selectively based on profiling results.
How can a business tell if a React app needs optimization?
Common signs include slow page loads, laggy filters or search, stuttering dashboards, and frequent user complaints about responsiveness. If key workflows feel slow on normal devices or networks, optimization is likely needed.
Work with eSparks IT Solutions
Planning a project around this? We help businesses across the USA, UK, Canada, Australia and the GCC ship it. Explore our Web Development services and portfolio, estimate your project cost, or book a free call.
Related web development services
S
Shayma Parween
Lead Developer
Passionate technology writer and industry expert with years of experience in software development, cloud computing, and digital transformation. Dedicated to sharing insights and helping developers stay ahead of the curve.
Related Topics
Continue Reading
More insights in Web Development

Web Development
Progressive Web Apps for Business: A Practical Guide
Learn when progressive web apps for business make sense, what they cost, key trade-offs, and how to choose the right architecture and partner.
Sep 22, 2026
Read More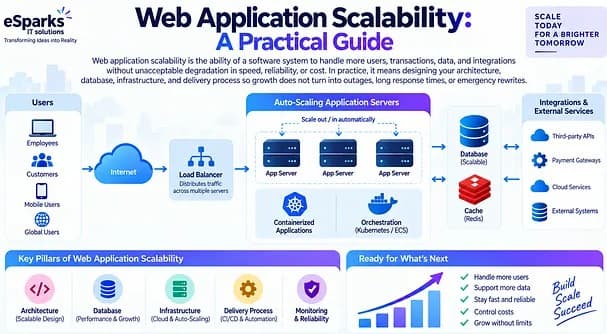
Web Development
Web Application Scalability: A Practical Guide
Learn what web application scalability means, how to design for growth, and which architecture, cloud, data, and DevOps choices matter most.
Sep 21, 2026
Read More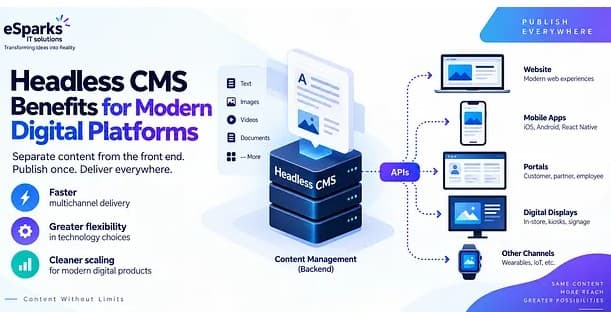
Web Development
Headless CMS Benefits for Modern Digital Platforms
Explore headless CMS benefits for web, mobile and omnichannel delivery, plus costs, pitfalls and a practical decision framework for leaders.
Sep 20, 2026
Read MoreReady to Transform Your Business?
Let's discuss how our expertise can help you achieve your goals